fggggvwgv

This sentiment meter reflects current demand-supply conditions in the unlisted market. It is not a rating and should not be considered advice to buy, sell, or hold. Sentiments are subject to rapid change and may not be real-time.
Want to stay updated? Add your target price and email, and we'll notify you.
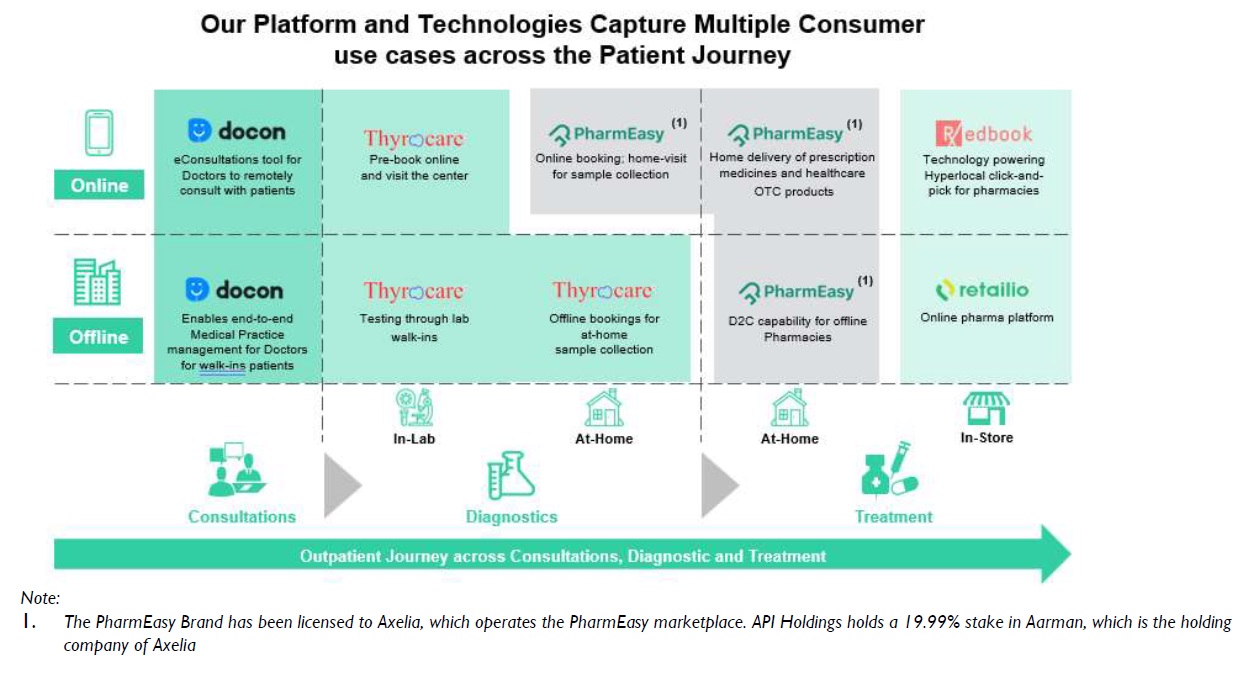
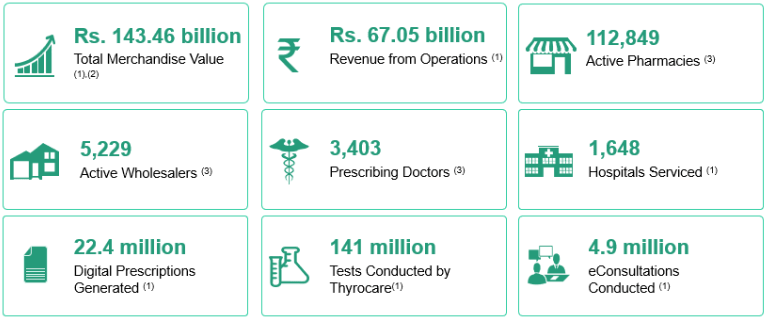
API Holdings (owner of PharmEasy) is India’s largest digital healthcare platform (based on GMV of products and services sold for the year ended March 31, 2021), according to RedSeer Report. API Holdings operate as an integrated, end-to-end business that aims to provide solutions for healthcare needs of consumers across the following critical stages
A. providing digital tools and information on illness and wellness,
B. offering teleconsultation,
C. offering diagnostics and radiology tests, and
D. delivering treatment protocols including products and devices.
API Holdings has custom-built proprietary technology, unified data platforms, supply chain capabilities, and deep understanding of the dynamic interplay between the various sub-segments of India’s healthcare market are the capabilities that differentiate them.
These capabilities enable them to provide each stakeholder in the healthcare value-chain, viz.:
(a) channel (wholesalers, retailers and chemists / institutions),
(b) consultants (and hospitals), diagnostic and radiology labs,
(c) consumers, and
(d) companies (pharmaceutical, nutraceutical, medical devices)
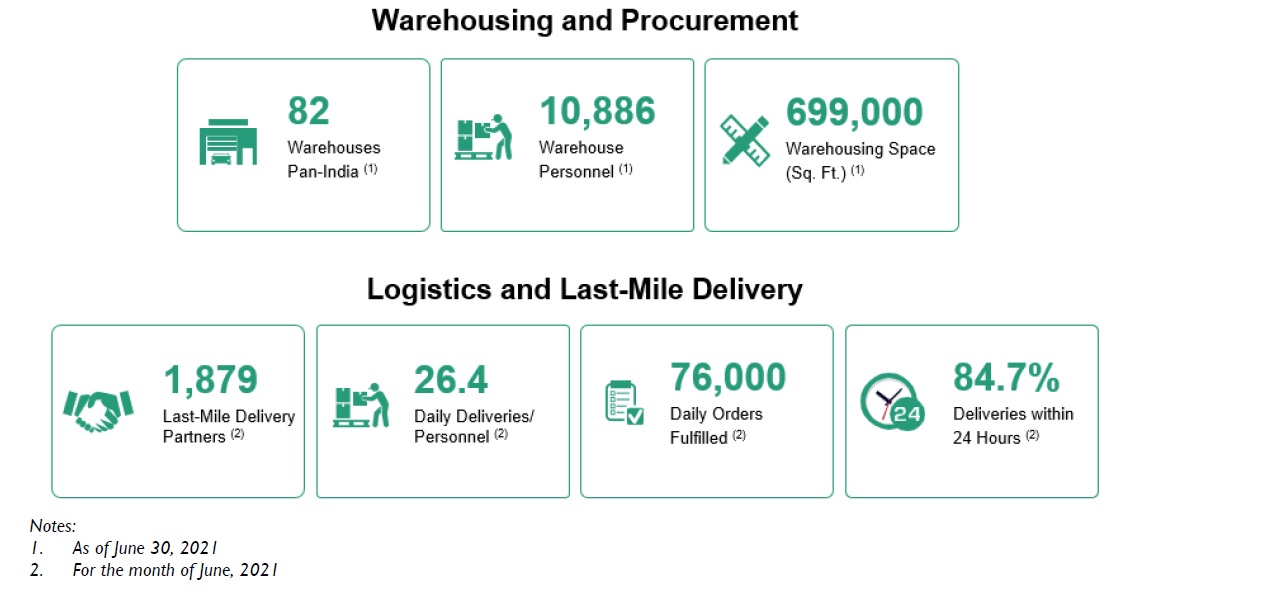
with the technology tools and capabilities to solve their challenges, while also enabling them to benefit from an interconnected network. At the same time, they also enable them to build a scaled presence, allowing their platform to reach a wide base of stakeholders across the length and breadth of this country. Their businesses have a presence across the country, with last-mile 163 capabilities to deliver in over 18,587 pin codes (for June 2021) via PharmEasy marketplace, allowing them the ability to provide access in an affordable manner to the common man. Their platforms have scaled across urban, semi-urban and rural India, with an ability to serve people across income groups and geographies.
 Source: PharmEasy IPO DRHP
 Source: PharmEasy IPO DRHP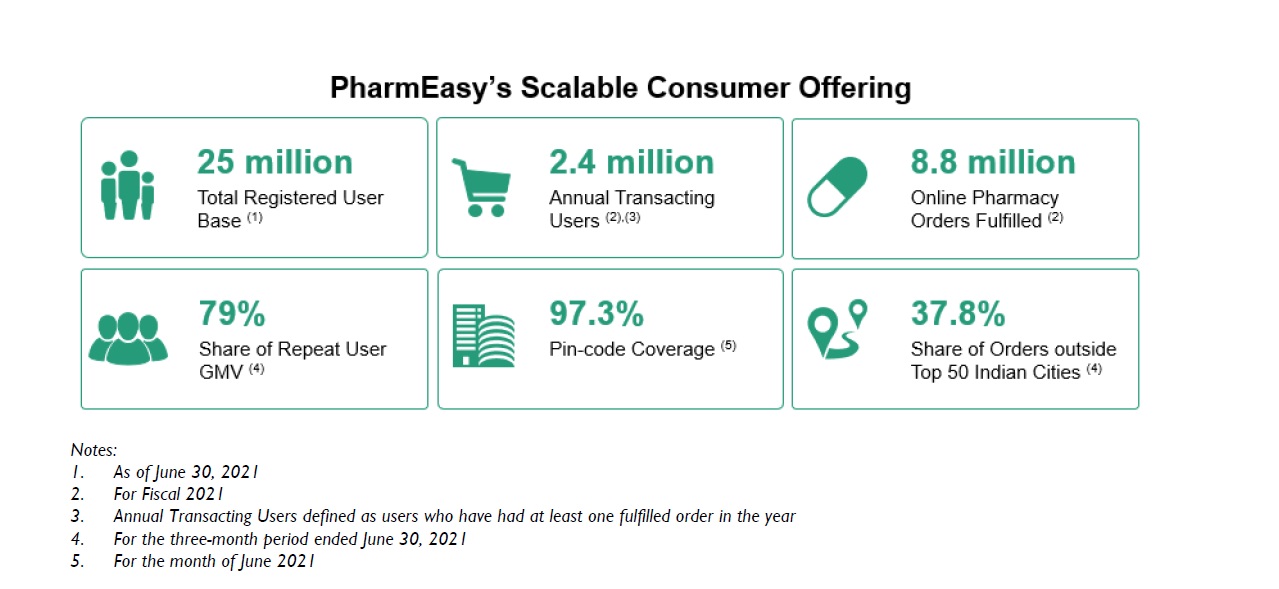
PharmEasy:
PharmEasy is a consumer healthcare “super app”.
PharmEasy is a consumer healthcare “super app” that provides consumers with on-demand, home delivered access to a wide range of prescription, OTC pharmaceutical, other consumer healthcare products, comprehensive diagnostic test services, and teleconsultations thereby serving their healthcare needs.
25 Million+Total Users
8.8 million+Total Orders
2.4 million+Transacting Customers
Services offered by PharmEasy:
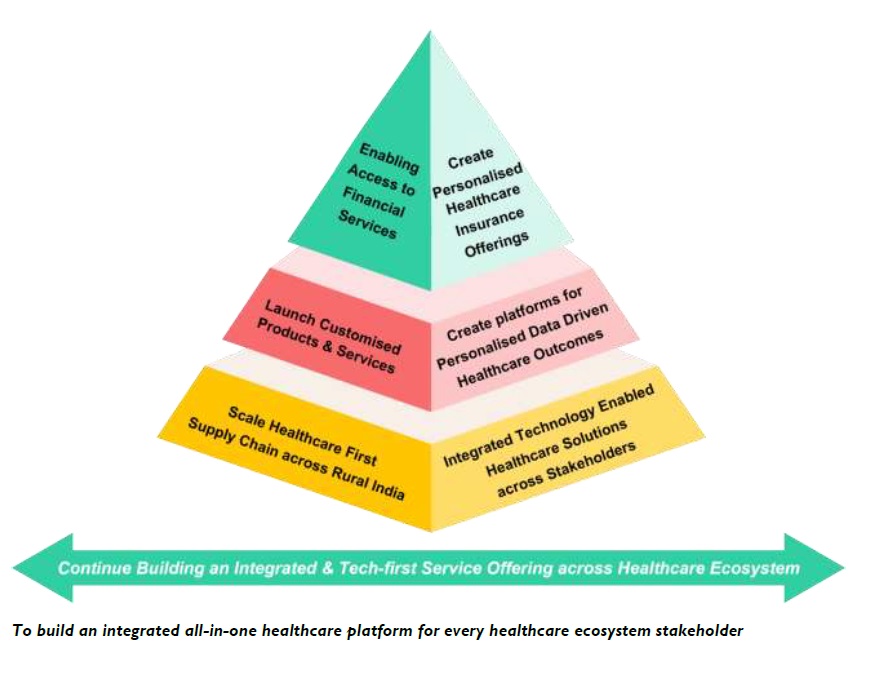 Source: PharmEasy IPO DRHP
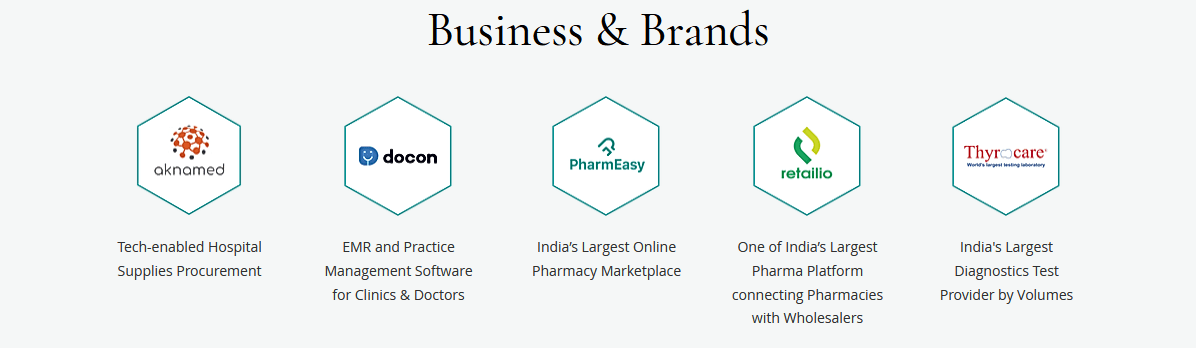
API Holdings (PharmEasy) Financial Review: Strategic Focus on Efficiency and Margin Improvement in Fiscal 2024:
In response to capital constraints throughout the year, API Holdings (PharmEasy) has strategically concentrated on sustainable revenue growth by prioritizing quality and enhancing the consumer experience.
These strategic actions highlight API Holdings’ commitment to financial prudence, operational efficiency, and sustained value creation. In our view, these measures lay a strong foundation for a resilient and agile financial future.

 9
9
API Holdings Right Issue of CCPS (2022):
Key Parameters of PharmEasy Rights Issue indicated by the company:
Know more about API Holdings (PharmEasy) Rights Issue-2022 in detail by reading our blog post here.
Figures shown in crores. YoY shown under each year; trend sparkline on the right.
| Particulars | 2023-24 | 2022-23 | 2021-22 | |
|---|---|---|---|---|
| Revenue from operations | 56,642.86 | 66,439.38 | 57,288.21 | |
| Other income | 946.55 | 558.33 | 521.81 | |
| Total income | 57,589.41 | 66,997.71 | 57,810.02 | |
| Cost of materials consumed | 1,645.09 | 1,569.20 | 854.60 | |
| Purchase of stock-in-trade | 45,728.06 | 55,120.60 | 52,566.12 | |
| Changes in inventories of stock-in-trade | 1,430.14 | 618.96 | (2,290.53) | |
| Employee benefits expense | 6,993.63 | 12,833.20 | 14,589.71 | |
| Finance costs | 7,279.16 | 6,655.43 | 2,582.64 | |
| Depreciation and amortisation expense | 2,159.52 | 2,434.40 | 1,587.85 | |
| Expected Credit Loss on Financial Assets | 1,692.64 | 683.37 |
api insights
 POSITIVE IMPACT
Negative cash flow
During the year found negatyive cahs flow
 NO EFFECT
Negative cash flow
During the year found negatyive cahs flow
 NEGATIVE IMPACT
Negative cash flow
During the year found negatyive cahs flow
Corporate Actions
There are currently no active or upcoming share buyback programs announced for this security.
api news
api annual reports
Try adjusting your search or filters.
Quick enquiry - tell us what you want and we'll reach out via WhatsApp or email.
This sentiment meter reflects current demand-supply conditions in the unlisted market. It is not a rating and should not be considered advice to buy, sell, or hold. Sentiments are subject to rapid change and may not be real-time.
Set a target price and we'll notify you when it's reached.
 FAQ's
FAQ's
api faq


fggggvwgv
now

A quiet, private space for unlisted share prices, market insights, updates, and important news.