Apollo Green Energy Limited Unlisted Shares
₹68
Apollo Green Energy Unlisted Shares Trend
This sentiment meter reflects current demand-supply conditions in the unlisted market. It is not a rating and should not be considered advice to buy, sell, or hold. Sentiments are subject to rapid change and may not be real-time.
Apollo Green Energy Limited Unlisted Shares - Create Price Alert
Want to stay updated? Add your target price and email, and we'll notify you.
Apollo Green Energy Unlisted Shares Details
ArenaX Toolkit
About Apollo Green Energy
Apollo Green Energy Limited (AGEL) is a leading renewable energy EPC (Engineering, Procurement & Construction) company focused on delivering sustainable energy solutions across India. Backed by more than two decades of EPC expertise through its parent organization, Apollo Green Energy is playing a significant role in India's transition toward clean, reliable, and future-ready energy infrastructure.
With over 20 years of EPC experience, Apollo Green Energy has established itself as a trusted name in the renewable energy sector. The company currently has 400 MW of solar projects under execution and has successfully completed 35+ renewable energy and infrastructure projects. Its strong execution capabilities are further demonstrated through 27+ EXIM-funded projects delivered across multiple geographies.
Supported by a team of 200+ experienced professionals, Apollo Green Energy maintains the highest standards of quality, safety, health, and environmental management, reinforced through its QSHE-certified operational framework.
Apollo Green Energy at a Glance
- 20+ Years of EPC industry experience
- 400 MW solar capacity currently under execution
- 35+ Successfully Completed Projects
- 27+ EXIM-Funded Projects Delivered
- 200+ Skilled Industry Professionals
- QSHE-Certified Processes and Operations
- Strong presence across India's renewable energy ecosystem
Apollo Green Energy Solutions
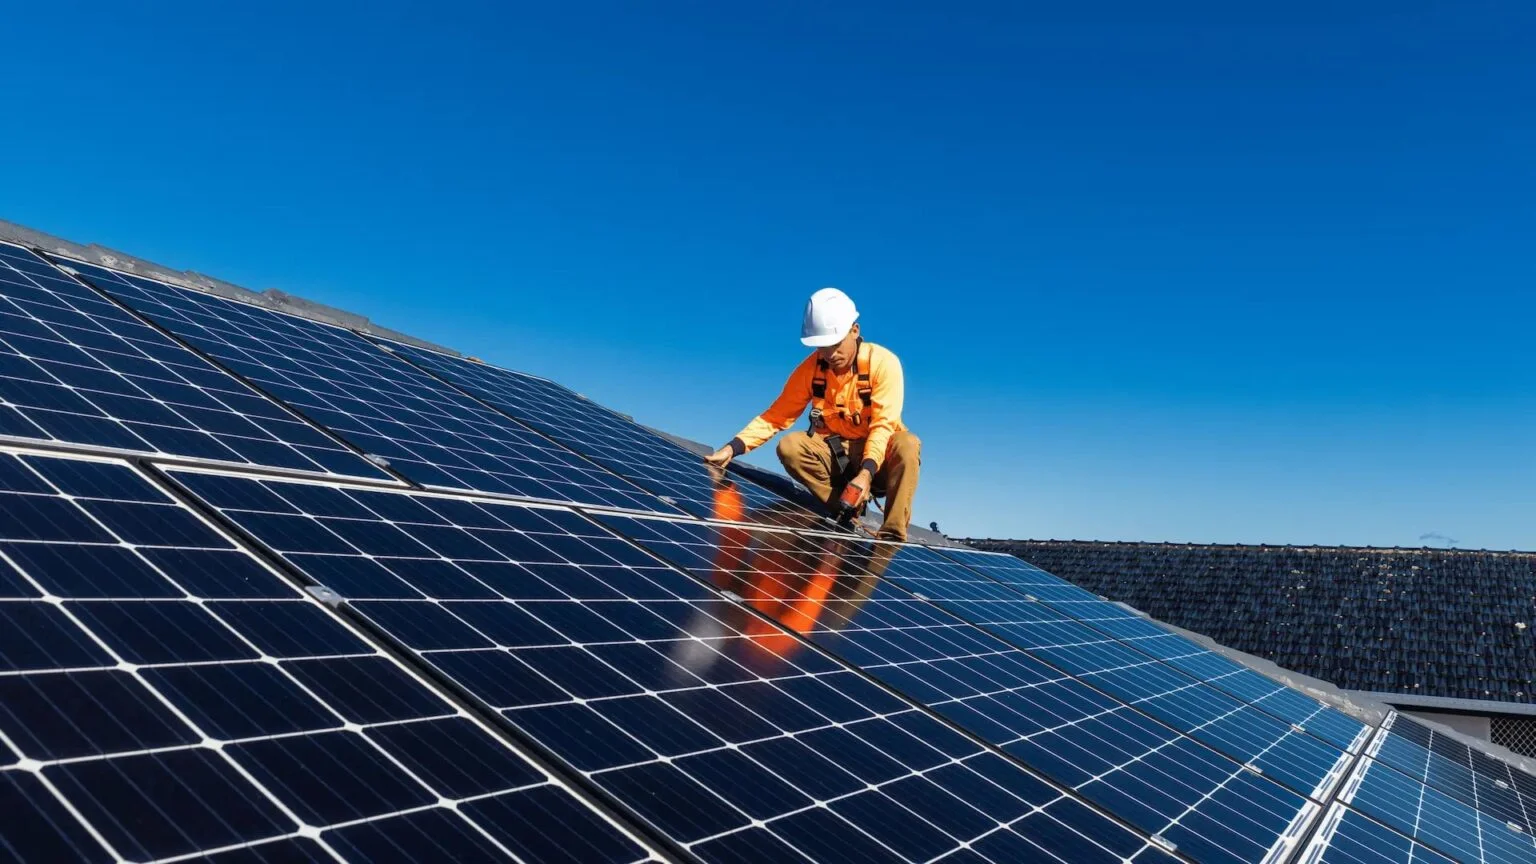
Utility-Scale Solar Power Projects
Apollo Green Energy specializes in the development and execution of large-scale solar power projects designed to meet India's growing clean energy requirements. The company delivers customized solar EPC solutions optimized for diverse climatic and geographical conditions, ensuring maximum energy generation and long-term operational efficiency.
Key Features
- Advanced photovoltaic (PV) technology selection
- Site-specific engineering and project design
- Optimized energy yield and land utilization
- Efficient grid connectivity and integration
- Long-term sustainable power generation
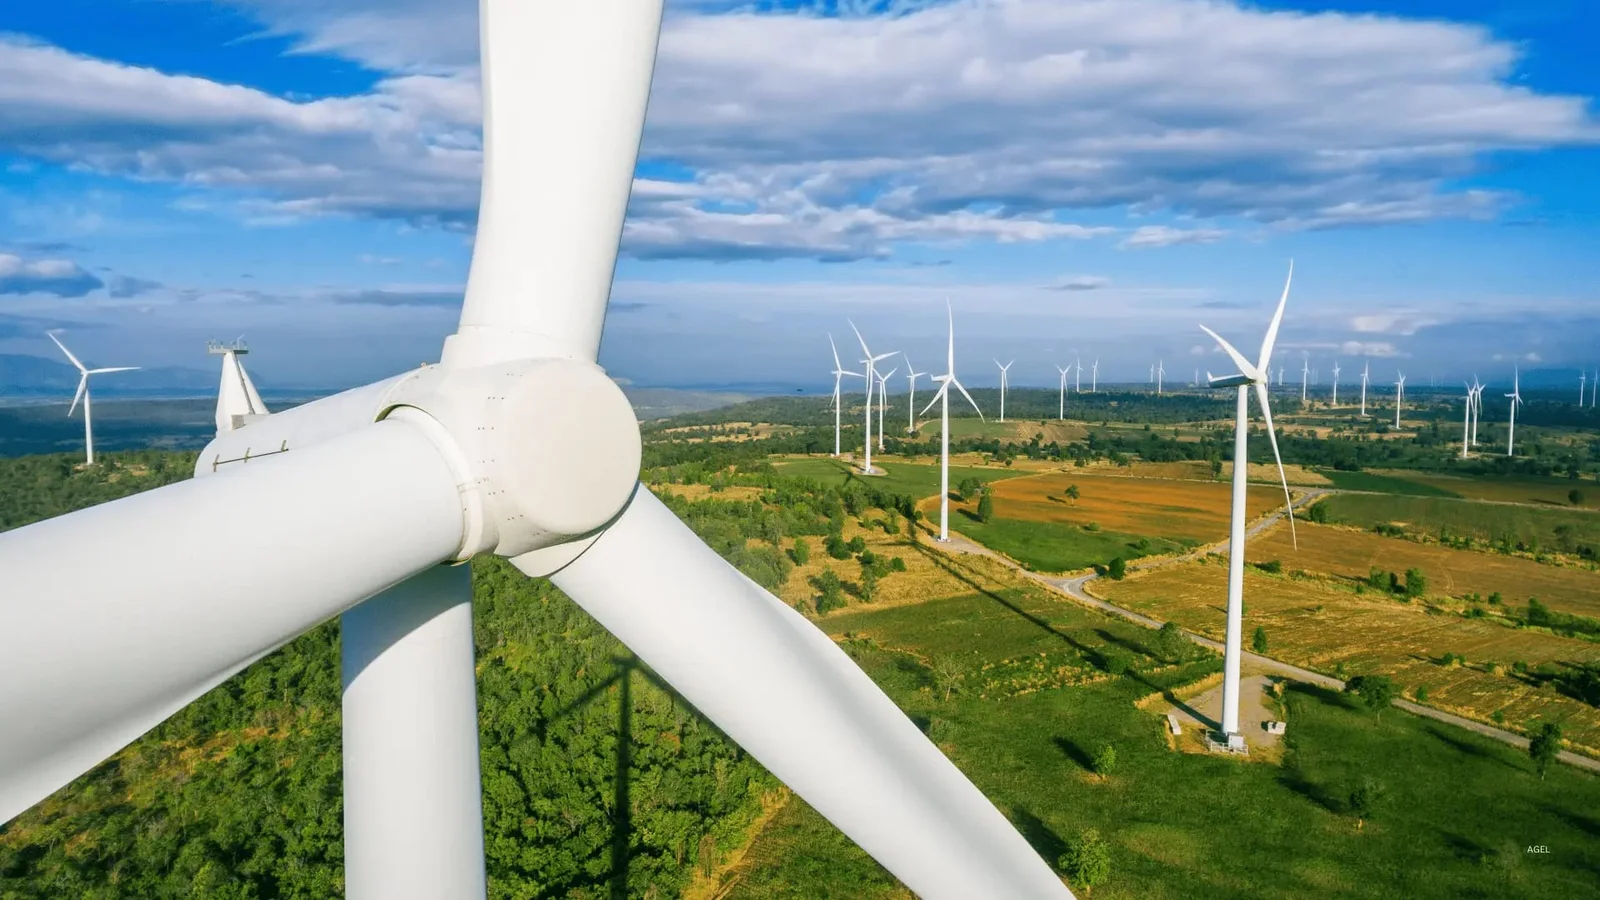
Wind Energy Solutions
Apollo Green Energy develops and executes both onshore and offshore wind energy projects, leveraging advanced turbine technologies and detailed wind resource assessments. The company focuses on maximizing power generation while maintaining environmental sustainability throughout project lifecycles.
Key Highlights
- Comprehensive wind resource analysis
- Strategic turbine selection and placement
- Optimized project performance and efficiency
- Environmentally responsible development practices
- Long-term renewable energy generation capabilities
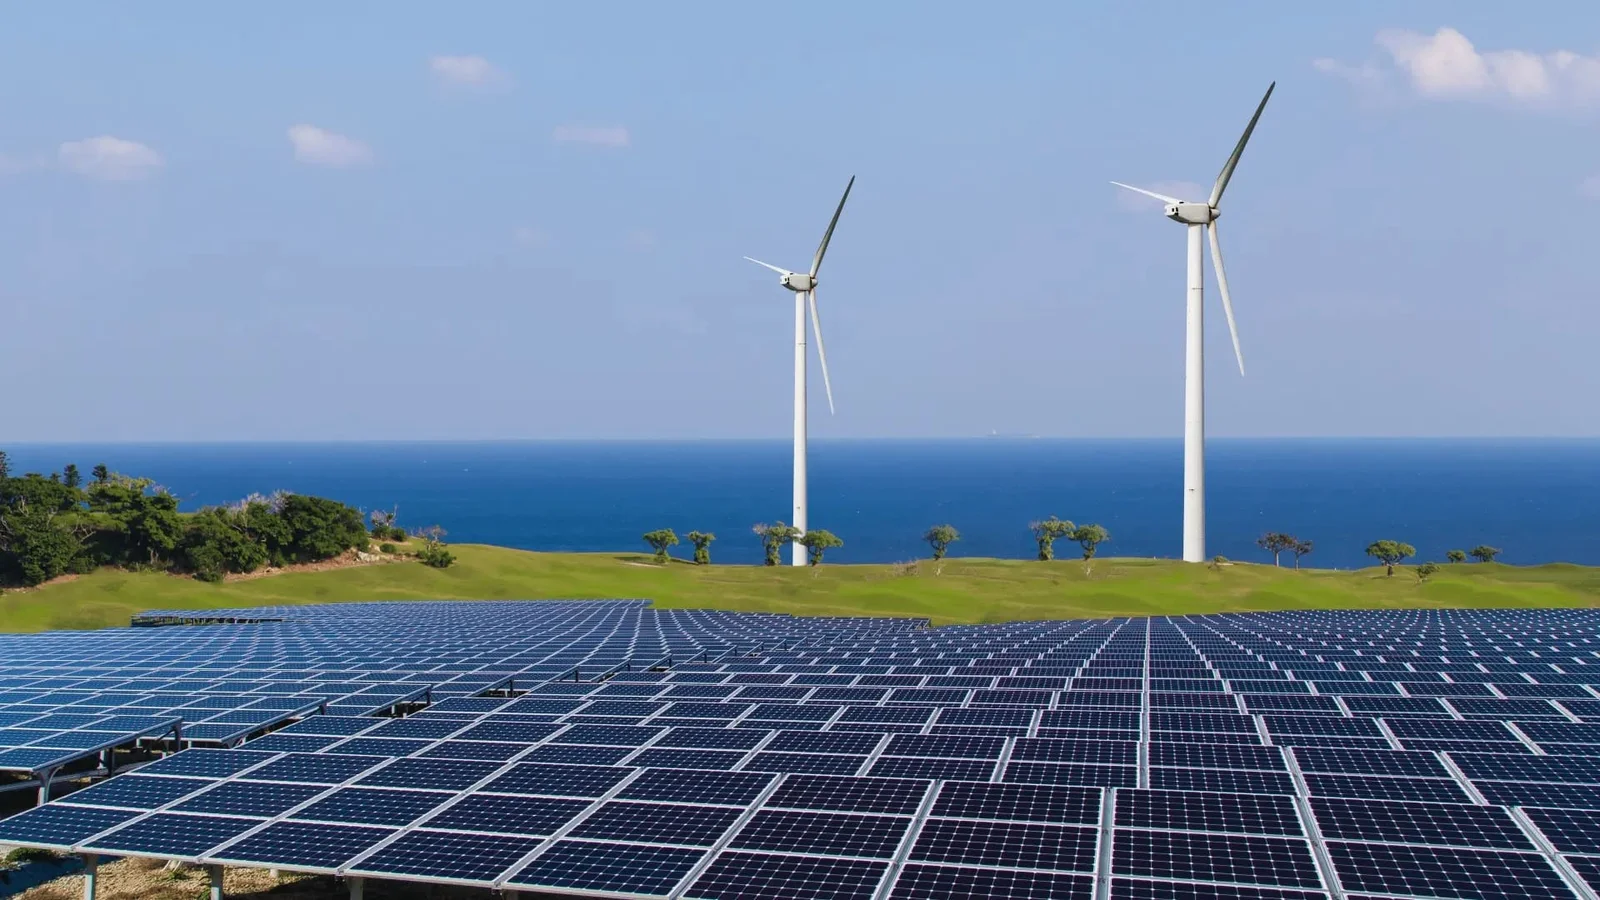
Hybrid Renewable Energy Systems
To enhance energy reliability and grid stability, Apollo Green Energy offers integrated hybrid renewable energy solutions that combine solar, wind, and energy storage technologies. These systems are designed to deliver consistent power output while maximizing renewable energy utilization.
Key Features
- Customized hybrid energy system design
- Solar, wind, and storage integration
- Intelligent energy management systems
- Improved power reliability and efficiency
- Enhanced grid stability and operational flexibility
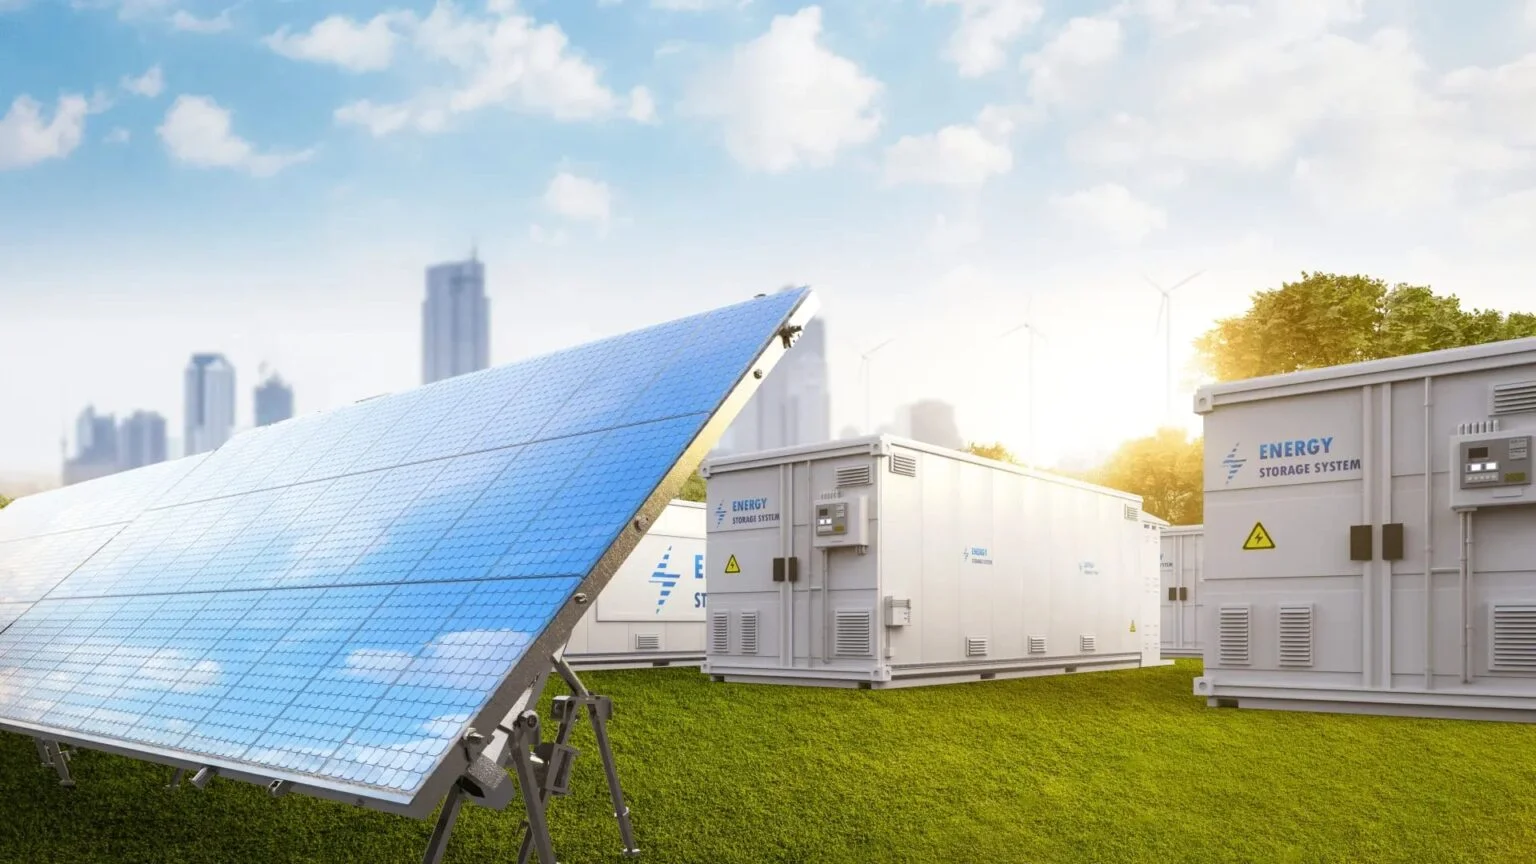
Energy Storage Solutions
Apollo Green Energy provides advanced energy storage solutions that support renewable energy integration and improve power system resilience. These solutions help address intermittency challenges while enabling reliable and dispatchable clean energy delivery.
Key Solutions
- Battery Energy Storage Systems (BESS)
- Pumped Hydro Energy Storage Solutions
- Grid balancing and stabilization systems
- Renewable energy integration support
- Enhanced energy security and reliability
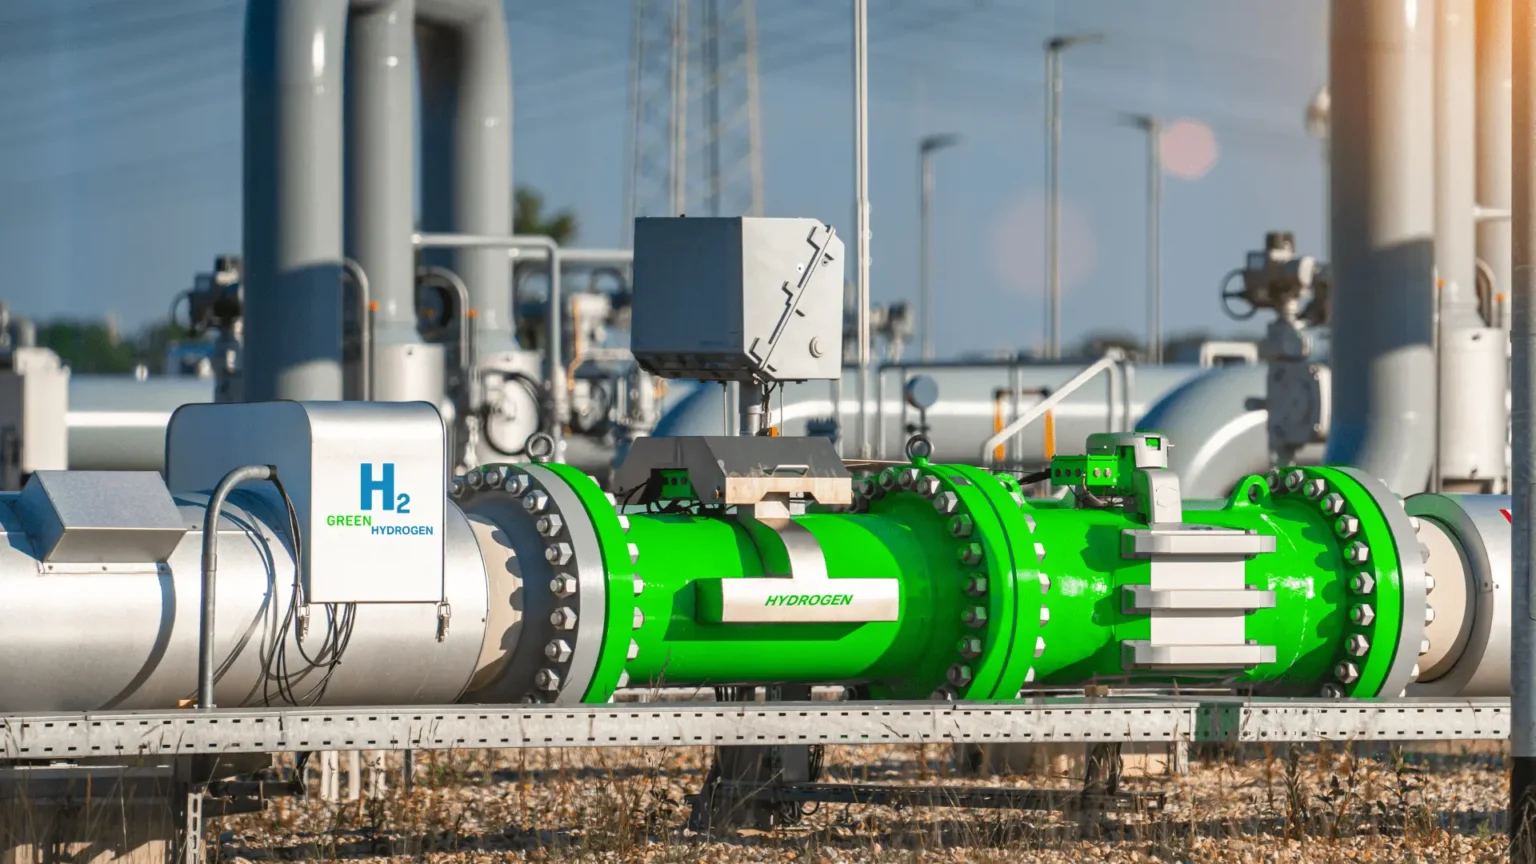
Green Hydrogen Infrastructure
As India advances toward a hydrogen-based clean energy economy, Apollo Green Energy is actively developing green hydrogen infrastructure powered by renewable energy sources. Through advanced electrolysis technologies, the company supports sustainable hydrogen production for industrial and commercial applications.
Key Highlights
- Renewable energy-powered electrolysis systems
- Clean and zero-emission hydrogen production
- Industrial-scale green hydrogen infrastructure
- Seamless integration with existing industrial operations
- Scalable hydrogen production capabilities
Why Apollo Green Energy?
Apollo Green Energy combines extensive EPC expertise, strong project execution capabilities, and a diversified renewable energy portfolio to support India's clean energy ambitions. From utility-scale solar and wind projects to hybrid systems, energy storage, and green hydrogen infrastructure, Apollo Green Energy is building the foundation for a sustainable and energy-secure future.
Apollo Green Energy Financials
Income Statement
Figures shown in lakhs. YoY shown under each year; trend sparkline on the right.
| Particulars | FY 2022-23 | FY 2023-24 | FY 2024-25 | Trend |
|---|---|---|---|---|
| Revenue | ||||
| Revenue from operations | 75,340 | 1,23,427 | 80,468 | |
| Other income | 3,745 | 3,409 | 5,088 | |
| Total income | 79,084 | 1,26,836 | 85,736 | |
| Expenses | ||||
| Purchase of stock in trade | 22,513 | - | - | |
| Cost of Raw material Consumed | 9,549 | 8,170 | 8,847 | |
| Changes in inventories of stock in trade | (267) | (145) | 1,295 | |
| Work bills, project supplies & expenses | 30,494 | 96,939 | 61,580 | |
| Employee benefit expenses | 5,657 | 5,043 | 3,887 | |
| Finance costs | 2,716 | 5,717 | 2,509 | |
| Depreciation and amortization expenses | 604 | 897 | 688 | |
| Other expenses | 5,253 | 6,217 | 2,732 | |
| Total expenses | 76,519 | 1,22,840 | 81,539 | |
| Profit(Loss) before tax | 3,217 | 4,117 | 4,258 | |
| Tax Expenses | ||||
| Current tax expense | (691) | (574) | (781) | |
| Mat credit entitlement | - | 824 | 343 | |
| Deferred tax charge / (credit) during the year | (56) | (508) | (453) | |
| Total tax expense | (747) | (258) | (892) | |
| Profit /Loss for the year | 2,471 | 3,859 | 3,366 | |
| EPS (In ₹) | 13 | 20 | 5 |
Apollo Green Energy Unlisted Shares - Key Insights
-
 NO EFFECT
EPS Moderation
Earnings Per Share (EPS) declined to ₹5 in FY25 from ₹20 in FY24. The decrease was primarily influenced by lower consolidated profits and a significant increase in the company's equity share capital during the year.
-
NO EFFECT
Profitability Remains Strong
Profit after tax stood at ₹3,366 lakh in FY25 compared to ₹3,859 lakh in FY24. While profitability moderated during the year, Apollo Green Energy continued to deliver healthy earnings amid its strategic business transformation.
-
 POSITIVE IMPACT
Lower Operating Costs
Total expenses declined significantly to ₹81,539 lakh in FY25 from ₹1,22,840 lakh in FY24. The reduction reflects a leaner cost structure and improved operational efficiency as Apollo Green Energy streamlined its business operations.
-
 NEGATIVE IMPACT
Revenue Decline
Apollo Green Energy's total income declined to ₹85,736 lakh in FY25 from ₹1,26,836 lakh in FY24, reflecting the impact of business restructuring and the divestment of certain non-core verticals. Despite lower revenue, the company remained focused on strengthening its renewable energy and EPC operations
Apollo Green Energy Unlisted Shares Peers
Similar Stocks
Apollo Green Energy - News
ECONOMIC TIMES
Apollo Green Energy to form subsidiary; invest Rs 500 cr to build 1GW portfolio
The subsidiary will focus on utility-scale solar while integrating advanced energy storage solutions including hydrogen-based systems, a company statement said
BUSINESS STANDARD
Apollo Green Energy prepares for IPO, eyes Rs 10,000 cr portfolio by 2025
Apollo International's renewable energy arm in the EPC sector looks to build its Rs 3,500 crore portfolio before going public in 2025
Apollo Green Energy to form subsidiary; invest Rs 500 cr to build 1GW portfolio
The subsidiary will focus on utility-scale solar while integrating advanced energy storage solutions including hydrogen-based systems, a company statement said
Apollo Green Energy prepares for IPO, eyes Rs 10,000 cr portfolio by 2025
Apollo International's renewable energy arm in the EPC sector looks to build its Rs 3,500 crore portfolio before going public in 2025
Apollo Green Energy Unlisted Shares - Annual Reports
Apollo Green Energy Limited Unlisted Shares Shares
Quick enquiry - tell us what you want and we'll reach out via WhatsApp or email.
Apollo Green Energy Unlisted Shares Trend
This sentiment meter reflects current demand-supply conditions in the unlisted market. It is not a rating and should not be considered advice to buy, sell, or hold. Sentiments are subject to rapid change and may not be real-time.
Apollo Green Energy Limited Unlisted Shares - Create Price Alert
Set a target price and we'll notify you when it's reached.